The origins of the Bay Area Rapid Transit District date back to 1947, when the joint Army-Navy board suggested construction of a rapid transit tube beneath San Francisco Bay, to speed travel between Oakland and San Francisco. During the Second World War (1939-45), railroad, aviation, logistical supply and port facilities mushroomed around the Oakland-Alameda estuary, surpassing San Francisco in volume of commerce.
In 1951 state legislation was enacted to create a S.F. Bay Area Rapid Transit Commission, with directors selected from the nine bay Area counties. Feasibility studies for a transbay tube were completed in the early 1950s and submitted to the state for review in January 1956. This original report envisioned a 300-mile long system tying then-developed portions of the Bay Area together with the most modern rapid transit system conceived up until that time. During the same interim, rush hour traffic in Oakland and San Francisco increased 44% between 1954-59, spurring dire predictions of complete gridlock by 1970 (Godfrey, 1966). Further east, traffic increased 115% along Highway 24 in Contra Costa County between 1955-67 (Payne, Russell and Pacheco (1968).
In June 1957 the State approved creation of a Bay Area Rapid Transit District, called "BARTD". This was subsequently shortened to the BART acronym we recognize today. Sonoma, Santa Clara, Solano and Napa Counties were not taken into the original district because planners did not perceive a need for commuter transit service from outlying areas. At this same time, it was decided to abandon the electrified Key System commuter rail service across the lower deck of the S.F. Bay Bridge, transforming the structure into the double-decked freeway in use today, with 6 traffic lanes in both directions.
Engineering feasibility studies were performed between 1957-61. In early September 1961 BARTD released its initial engineering plans for a five-county system, reproduced in Fig. 1. This plan envisioned using the Golden Gate Bridge for trains, but the Golden Gate Bridge District disapproved the concept, and Marin County was left out of subsequent plans. Flush with the new Bayshore Freeway (US 101), and the Junipero Serra (Interstate 280) freeway then in planning, the San Mateo County Board of Supervisors rejected participation in BART in December 1961. This decision obviated the original plans to serve San Francisco International Airport, subsequently resurrected in the 1990s. The reasoning of other Bay Area counties was likely influence by the nearly $100 million annual expenditures in highway construction in the S.F. Bay Area during the 1960s, the lion's share of which came from the Federal Highway Trust Fund, without additional local taxation.
In November 1962, 61.2% of the voters in San Francisco, Alameda and Contra Costa Counties (as an aggregate total) voted to be a part of the new rapid transit system, approving a $792 million construction bond, with another $133 million was to come from Bay Bridge tolls (Demoro, 1968) The envisioned cost of $996 million made BART the first "billion dollar mass transit project", attracting hundreds of contractors to the Bay Area. The new 75-mile light rail system would serve these three counties, as shown in Fig. 2.
In the late 1960s annual inflation approached 7%, more than double the economic predictions utilized in the original plans back in 1962. From mid-1967 onward, the system fought one financial crisis after another, struggling to remain afloat. The balance of funds to complete BART came from local, state and federal sources, including a Federal mass transportation demonstration grant, a capitol construction grant from Federal Housing and Urban Development, 1966 Urban Mass Transportation Act monies, and $150 million from additional sales taxes in the three counties served by BART (enacted in April 1969, to bail the project out). The actual construction figure ended up being about $1.6 billion, $315 million of which came from the Federal government.
In large part due to the frustrations completing BART, the federal Urban Mass Transportation Assistance Act (UMTAA) of 1974 mandated federal assistance of 80% of all capital costs for new mass transit systems. As the pioneer mass transit project, 80% of BART's funding came from local sources, but UMTAA funds would play a major role in allowing the system-wide extensions completed in the 1990s (Fig. 2).
Engineering expertise was brought in from across the country to deal with the many pioneering aspects of the first "from the ground up" rapid transit system to be constructed in America in almost 50 years. $47 million was set aside for engineering in the 1962 bond. A joint venture was formed between the engineering firms of Parsons, Brinkerhoff, Quade & Douglas, Tudor Engineers and Bechtel Corporation (hereafter referred to as PBTB), who collectively served as BART's general engineering consultants throughout the project (1962-75). Tudor and Bechtel were San Francisco based firms, while Parsons-Brinkerhoff was based in New York. Parsons had previously been engaged to perform a comprehensive mass transportation study for the Bay Area, completed in 1957.
The original PBTB design team employed about 300 engineers, which swelled to nearly 8000 engineers and technicians during construction. Based on testing by Stanford Research Labs in wind tunnels, in September 1963 PBTB selected lightweight electrified cars running on 115 pound (per 3 feet) rails. The spacing between rails was spread from 4'-8-1/2" standard gage to 5'-6" apart, to increase high speed lateral stability. The design speed of the system was intended to be between 50 and 80 mph, while the entire right-of-way would be 100% grade-separated to avoid any delays associated with rail or vehicular crossings. This was deemed essential to maintaining reliable transit schedules that could compete favorably with freeway commuting (Bugge and Irvin, 1964).
Being in the Seismically active San Francisco Bay region, the PBTB consulting team was expected to design an "earthquake safe" rapid transit system. After considering the requisite earthquake loads, the PBTB team concluded that it would be impracticable to design BART structures to "entirely resist" the forces of a maximum event earthquake. This assessment was based on cost comparisons with the original 1962 estimates. The decision was made to design structures that would be able to accept earthquake induced deformations without causing permanent distortion, keeping the risk to both passengers and the system "within acceptable limits", and "still make the project economically feasible" (Chandler, 1969).
President Lyndon Johnson spoke at the formal groundbreaking ceremonies for BART's Diablo Test Track in Concord on June 19, 1964. The first rail was laid on the test track in January 1965, while construction of the main system commenced in early 1966. Receiving 2/3 of its funding from federal sources, the 4.5-mile long Diablo test track (built along the old Sacramento-Northern Railroad alignment) soon emerged as the prototype light rail test facility (Civil Engineering, 1964; Irvin, 1965). Being the nation's first high-speed electrified light rail system, the principal purpose of the test program was to evaluate the practicality of computerized Automatic Train Control (ATC). ATC testing was completed between April 1965 and February 1966. Data from the test track was subsequently used in other light rail systems then under construction in Montreal and Toronto, and those subsequently built in Washington, D.C., Baltimore and Atlanta.
The BART rolling stock set new standards as well. These were the first rapid transit rail cars to use big picture windows, carpeting in lieu of tile, to provide cushioning for sound and sight, no overhead storage bins, no station advertising and no smoking in any of the cars, which reduced ventilation costs by $1000 per car and lowered the car's profile by 12 inches (ventilation is taken through the window sills). Although 450 cars were originally budgeted in 1962, spiraling inflation of the late 1960s reduced the initial order to 150 A-cars and only 100 B-cars when orders were initially placed in February 1969. BART was also the first rapid transit system in America to be fitted with a automatic train control, capable of handling 50 trains simultaneously (developed by Westinghouse). BART also pioneered the use of magnetically coded tickets purchased from machines and graduated fares, based on distance traveled (Hammond, 1971).
Costing $1.4 billion and employing more than 100 contractors, BART was the first urban "mega project" of the post-World War II era. Of the 75 miles of right-of-way constructed in the initial phase, 20 miles were within tunnels or subways, 24 miles were constructed at grade, and 31 miles was built on suspended structures. There would be 37 stations, with capacity for 30,000 seated passengers per hour per track. In addition, the State of California agreed to construct 17 miles of new freeway right-of-way to accommodate BART within the median of State Highway 24, between Walnut Creek and Oakland, and along Interstate 280 between Mission Street and the Daly City terminus.
The bulk of the geotechnical exploration for the proposed rights-of-way was undertaken by Parsons-Brinkerhoff and Bechtel between 1963 and 1967. But, the short timetable and sheer volume of required information forced PBTB to also employ local engineering firms as subcontractors for geotechnical exploration of many segments. These subconsultants included: Dames & Moore, Woodward-Clyde-Sherrard & Associates, Harding-Miller-Lawson, and Cooper-Clarke. Hawke Engineers, a San Francisco based civil/structural firm, was even pressed into service to perform geotechnical explorations and provide foundation recommendations. Most of the geotechnical reports contained standardized boring logs, and were unusual in that they also contained a great deal of test data, as well as sample calculations of bearing capacity and consolidation potential, and recommendations for design values along specific contract segments.
The most expensive portion of the original BART system were the 3.6-mile long twin transbay tubes, originally estimated to cost $133 million. The actual $180 million price tag was paid by motor vehicle tolls on the S.F.-Oakland Bay Bridge (Godfrey, 1966). In mid-1960 Parsons, Brinkerhoff, Quade & Douglas (PBQD) drilled five exploratory borings in the Bay as part of feasibility studies (Swain, 1960) to confirm the general soil profile where it diverged from the S.F. Bay Bridge, where the underlying geology was already well documented (Trask and Rolston, 1951).
During 1964-65 PBQ&D (1965) drilled another 25 borings in the bay, more or less following the track of water-borne ferries that had plied the Bay prior to completion of the S.F. Bay Bridge in November 1936 (Fig. 3 upper). Of foremost interest to the design team were potential settlement problems, stability of the temporary excavations to be made in the bottom of the bay, and the likely presence of rock along the proposed alignment, shown in Fig. 4.
Settlement of the tubes was to be handled by employing compensated excavations, which would seek to remove more soil load overlying compressible strata than originally existed before placement of the tubes. The design team was most concerned about future settlement in vicinity of the east portal, where the Port of Oakland planned on extending their existing mole, across the tube's proposed alignment. The construction of this mole would increase the effective pressure bearing on compressible strata beneath the tube. This was handled by ....
The alignment was unique in that engineers sought to avoid good foundation materials, opting to keep the tube on as loose material as possible, so that its flexibility could distribute relatively large oscillations over its long length, and thereby avoid zones where bending stresses might be concentrated. Seeking to avoid the Yerba Buena rise in the Franciscan basement underlying central S.F. Bay, the design profile changed alignment both horizontally and vertically, dipping as much as 135 feet beneath the Bay, as shown in Fig. 3 lower. Grades were limited to a maximum of 3%, and a minimum of 0.3%, to facilitate drainage.
When the first phase of the Chicago Subway was being built in between 1939-42, soil loads were measured on test sections of two types of tunnels. One simulated a flexible circular lining, and the soil pressure on this structure was estimated by measuring interior deflections of the steel lining. Soil mechanics pioneer Professor Karl Terzaghi reasoned that soft clay needed to deflect modestly in order to develop fairly uniform stresses around the tunnel, after which it shouldn't deflect any more. Test results from the flexible Chicago test lining made by Ralph Peck suggested that, even with consolidation, the ultimate deflection never amounted to very much in soft clays.
But, the Second World War interrupted progress on the Chicago Subway before they had a chance to build tunnels with thinner sections. In the intervening 23 years between Chicago and BART, this information lay untapped, and subway designers continued to specify heavily reinforced tunnels. Believing that just enough steel was needed to handle the ring stresses because the soil loads arch around the flexible lining, University of Illinois Professor Ralph Peck found himself in the influential position of being one of the external consultants hired by Parsons-Brinkerhoff to review the overall plans and provide advice to the design team, between 1964-73. Peck convinced PBQD engineer Tom Kuesel that a great deal of money might be saved on BART by using flexible circular linings designed only for ring stresses only, ignoring bending. Kuesel (1968) succeeded in convincing others on the design team thin wall circular steel linings should work well in the soft clay soils that dominated the transbay tube alignment, due to its flexibility (to withstand differential settlement) and high tensile strength (200 psi) at the segment connections, which would offer greater performance redundancy in event of an earthquake.
The design team ended up specifying three different thickness for their circular steel lining, for differing overburden conditions (3/8 inch, ½ inch and 5/8 inch). All were designed as flexible linings, with only enough strength to hold themselves up, with acceptable deflections of 3 or 4 inches under their own weight. BART contracted with Kaiser Steel in Napa for the all their steel tunnel lining and the transbay tube shells.
In April 1966 BART awarded the initial $90 million construction contract for the transbay tubes to Trans-bay Constructors, a joint venture of Kiewitt, Raymond, Tidewater, and Healy-Tibbets. 19,113 feet of twin tubes in 57 sections were placed between the Oakland and San Francisco ventilation structures. Unique up until that time for a trench-type tunnel, were the horizontal and vertical curves built into the alignment, which required 15 horizontally curved segments, 4 with vertical curves and 2 with both.
The contractor excavated nearly 6 million cubic yards of Young Bay Mud, Merritt sand and undifferentiated organic silt encountered on the floor of the Bay along the proposed alignment, using a 13 cubic yard clamshell. This trench was between 33 and 133 feet deep, 60 feet wide at the base, with side slopes between 1.5:1 and 3:1 (horizontal to vertical), as depicted in Fig. 5. Excavated material was dumped into 2,000 cubic yard bottom dump barges, and disposed of in the tidal draw channel west of Alcatraz Island (no longer allowed).
The twin tube sections were between 273 and 366 feet long and averaged 11,000 tons apiece. The 3/8-inch thick raw steel pipes supplied by Kaiser Steel were fabricated into 57 binocular shape twin tubes 48 feet wide by 24 feet high at the Bethlehem Shipyard in South San Francisco. After launching into the bay, they were outfitted with 24-inch thick interior concrete linings, designed to combat buoyancy, as well as concrete floors, walls and walkways. An emergency accessway and exhaust air ducts were constructed between the 17-feet diameter tubes, which were spaced 8 feet apart. The tubes were sealed at either end and sunk
After fitting out, the tube sections were sealed at either end and floated to a catamaran placing barge, from which they were suspended (Fig. 6) for lowering. Contrary to popular belief, the tubes were never filled with water, they were sunk by dumping 500 tons of gravel onto ballast pockets built atop the tubes, gradually lower them into position (Murphy and Tanner,1966, Engineering News Record, Nov 16, 1967). The tubes were set on 2 feet thick gravel blankets placed within 0.15 feet of design grade, across the floor of the dredged channel (Fig. 5). The goal was to place each tube about 2 feet from the existing line of tubes, then bring them within 1 inch of design alignment using 50-ton hydraulic jacks with 39-inch strokes, connected to four railroad car couplers installed at each end.
Once positioned, water was trapped between the two end bulkheads, between neoprene gaskets. This trapped water was bled from the joint and pumped out, creating some buoyancy, but the pumping also brought the sections closer together, under vacuum. The temporary bulkheads on both sides of the new joint were then removed and reused on other sections. Liner plates were welded across the new joint from the inside to make a permanent connection capable of transmitting 200 psi in tension. A 2 feet thick concrete lining was then placed within the transition (the remaining lining having already been placed at Bethlehem's dock.
Once attached, a specially configured screed barge was placed over the newly placed tube and fixed into place by means of four 140-ton anchors attached to positioning winches. Two 17 feet diameter floatation tanks could then be flooded to submerge the 16 feet deep barge to only 4 feet of freeboard, steadying the barge. The screed barge used 3 inch diameter pipes to place sand and gravel backfill with relative position around the sunken tubes (Fig. 5). The tunnels were also provided with cathodic corrosion protection.
Beginning in September 1966 the first tube was placed against the west side of the Oakland Ventilation structure. 26 sections were then placed, stretching 2 miles into the Bay by April 12, 1968. Upon completion of the more extensive San Francisco ventilation structure, work shifted to that side of the Bay, preceding easterly across the Bay. A special earthquake joint was attached to the west end of the westernmost tube, adjoining the ventilation structure. This joint was fabricated and attached to the 324-feet long section at the Kaiser Steel Yard in Napa. About one tube section was placed every two weeks, and placement was completed in early April1969 (ENR, April 10, 1969).
There have been five leaks of the transbay tube during the initial 30 years of operation. On several occasions pin-sized holes have developed in exterior steel lining, which have quickly been detected by observation of the accumulated seepage. Following the October 17, 1989 M 7.0 Loma Prieta Earthquake BART engineers discovered seepage emptying into the tube and the line was shut down for day of inspection. In 1977 a fire in the eastbound tube caused the death of one Oakland fireman because of toxic fumes given off by burning polyurethane seat cushions.
Up until that time the BART sunken tube tunnels were the longest and deepest ever built (Warshaw, 1968). The success of the BART tubes led Parsons-Brinkerhoff to design similar structures for the Hong Kong Cross Harbor Tunnel (completed in 1972), the East River 63rd Street Tunnel in New York City (completed in 1974) and the Second Hampton Roads Bridge-Tunnel (completed in 1976). These projects were described in Kuesel (1974).
Early laser alignment techniques were pioneered on he BART job to aid positioning of the dredges as well as the steel train tubes placed in the dredged channel. Lasers provided distinct advantages over conventional range poles and sextants because their effective range was 5 miles, more than enough to accommodate the transbay crossing. A major concern at the outset was the potential impact of fog on the optical reference system. The inch wide laser beams were projected as spot beams, as well as horizontal and vertical lines, depending on the need. Divergence of the beam at one mile was 6 inches. By bisecting the beams, centering within 0.10 feet was accomplished at ranges over 2 miles.
For setting stations across the bay, the engineers set up a 2-million candlepower blinker at a known point on shore. The contractors then used a conventional sextant to measure the angle between the laser beam set on tangent, and the blinker. Because of all the curves in the alignment, as series of chords had to be set up. Vertical tolerance for the tube bedding was set at 0.15 feet, while the final resting positions of the tubes had top be within 2.5 inches of design location, due to the tangents and spirals of the design alignment. Before sinking, survey towers were attached to each tube section, parallel to finish grade The contractor built a survey barge equipped with an array of electronic and optical gear. With this, they were able to prepare cross sections every 25 feet to evaluate tolerances and make the necessary adjustments. These techniques were described in Civil Engineering (1967) and Bengston (1968).
The most challenging segment of the BART underground work were the twin tunnels running between Montgomery Station and the west ventilation structure, through the foot of Market Street. A steel frame ventilation structure 122 by 68 feet in plan and 108 feet high had been established about 450 feet offshore from the S.F. Ferry Building, where the tracks reach elevation -85 feet (Figs. 4 and 7). The S.F. ventilation structure provided a transition between the these tunnels and the Transbay tubes, situated be far enough from the San Francisco Ferry Building to avoid possible impact on that venerable structure, should an earthquake have occurred during the deepest excavation work.
In the segment between the Montgomery Station and the vent structure the Young Bay Mud reaches a thickness of nearly 100 feet, and these shield tunnels had to rise through a maze of old timber piles supporting the Ferry Building and wharf complex, a massive sea wall, an active railroad, abandoned underpass, countless utilities and the steel H-pile supported Embarcadero Freeway (Interstate 480, whose superstructure was later demolished following damage sustained during the October 1989 Loma Prieta Earthquake).
The $14.6 million construction contract was awarded to a joint venture of Perini-Brown & Root, using conventional soft ground tunnel shields under air pressure, spaced at least 300 feet apart (described in Peterson and Frobenius, 1971). The contractor was confined to 100 x 200 feet waterfront staging area, with a 50-feet wide stretch up Market Street. Special "risk sharing" contractual clauses drawn up by the PBTB team provided for extra payment for removal of substantial buried obstructions in this segment, such as buried gold rush era sailing ships and old timber piles (Kuesel, 1969). It wasn't long before the contractor's shield began traversing a forest of timber piles. Though no longer supporting buildings, these piles were tied together by overlying concrete pile caps, without carrying any significant structural load. These conditions proved nerve racking for the contractor, and he was forced to advance the excavation with shields while probing ahead, finding the old piles, then using chain saws to sever the piles 3 to 4 inches above and several inches beneath the shield.
Although the length of most piles left above the tunnel linings was only 4 to 6 feet, the resident engineer was concerned about negative skin friction (downdrag) pulling these piles down onto the thin steel membrane of the tube's flexible linings. Though engineers doubted downdrag could be developed in such short piles, it soon did, and the lining developed a series of obvious dimples. The contractor had to weld plates and fashion makeshift stiffeners to keep the dimples from preceding further.
During driving of the first shield, the contractor encountered soft ground sooner than expected, and Tunnel No.1 "holed through" into the offshore ventilation structure in early April 1969, ahead of schedule (ENR, April 10, 1969). On the second bore, the contractor installed new mucking equipment that doubled production and changed their procedures to seal off the tunnel at the vent structure in half the time. As a consequence, the second bore was completed in late June 1969, 3 months ahead of their 22-month schedule (ENR, July 3, 1969).
25 years later, when the S.F. Muni turnaround was built across this same foot-of-Market Street area, excavations came within 4 feet of the BART tubes, but only imperceptible movements were recorded in the BART tunnels (Hashash, et al, 1995). This stellar performance testified to the theories upon which the flexible lining support system were based. Although Chicago never benefited from their pioneering subway test sections, BART sure did, and it became the model for all subsequent rapid transit systems built in the ensuing decades.
The site that originally concerned PBTB most was Montgomery Street Station, which lay at the original shore of San Francisco Bay. The lower Market Street area had been explored and characterized for BART by Dames & Moore (1964), presented in Fig. 7. At that time the Embarcadero Station was not envisioned, as there was between 80 and 95 feet of Young Bay Mud below water table, and the proposed rail level would still be 80 feet below street level, an unprecedented excavation in the waterfront area. In addition, all the Market Street stations had to be sandwiched between large pile supported structures while utilities and transportation arteries remain working.
BART plans envisioned cut-and-cover excavations up to 80 feet deep and 61 feet wide at the three major stations along lower Market Street, Montgomery, Powell and Civic Center. The stations would have to be double decked, in order to accommodate San Francisco's municipal railway system (MUNI). MUNI already connected the downtown financial district with the City's western additions, through the Twin Peaks streetcar tunnel, completed in 1918. The MUNI system was to be upgraded with new electrified trolleys in the wake of BART, and initial contracts for this work were let in late 1973.
Soldier pile tremie concrete (SPTC) technology had recently been pioneered by San Francisco contractor Ben C. Gerwick, Inc., on the Bank of California building in 1964-65 (Gerwick, 1965). The PBTB design team was impressed by the recent success of the SPTC support system at this site because it was close to the Bay, working in young bay muds below sea level, with high groundwater. The decision was made in mid-1966 to implement SPTC support systems on the Montgomery and Powell Stations. The massive SPTC support system proved very successful, and the measured movements were small.
But, the City of San Francisco felt a station was badly needed along the Embarcadero to serve the waterfront, where more than $100 million in new building construction was either underway or contemplated in the immediate area. In November 1967 private developers fronted $500K for engineering fees to pay BART to begin designing a "Davis Street Station", at the foot of Market. In April 1968 the San Francisco Board of Supervisors approved $15 million for the construction of what became the Embarcadero Station. Like the other Market Street stations, BART would be accommodated on a lower deck with MUNI above (Fig. 8). Embarcadero Station would be 700 feet long, 80 feet deep, and closest to the Bay of the 34 stations on the BART system.
However, when design began it soon became apparent that the factor of safety for heave in the floor of the Embarcadero Station excavation was too low. For weeks PBTB engineers debated how to design an excavation that would stand up to the terrific hydrostatic and lithostatic pressures generated by up to 80 feet of young bay mud. Many options, such as progressive excavation, ground freezing, eggcrate slurry walls, thick mats, were discussed and evaluated. In the end they opted for employing extremely thick "heave piles", a heroic measure intended to support the adjacent ground with brut strength, because of all the existing structures lining Market Street.
At the core of the Embarcadero SPTC wall were W36-182 soldier piles with specially-fitted circular "pile tips", placed in drilled 36-inch diameter shafts, extending 110 feet below grade (Fig. 8). But, in those vertical zones supporting soft bay muds, the flanges of the solider piles were beefed up to W36x300 sections, using thickened flanges (Armento, 1973). These comprised the heaviest soldier piles ever used for shoring in San Francisco up until that time.
The SPTC method used a bentonite mud slurry to support the sides of the caisson holes, in the same manner as an uncased water or oil well. Once excavated to the desired depth, the 36-inch steel soldier piles were lowered into the slurry-filled holes and concrete was tremied into the annulus, displacing the bentonite slurry upward. Once the caissons were installed, the intervening space between caissons was excavated and also supported with slurry, until displaced by tremie concrete, forming walls 3 to 4 feet thick. These walls comprised the SPTC temporary bulkhead. The upper 28 feet of the slurry wall was subsequently demolished as the permanent station was built, requiring blasting which occasionally damaged the piles (ENR, Jan. 17, 1974). New permanent concrete walls were built inside the SPTC structure below -28 feet, as excavation for the stations preceded downward. At Embarcadero, some of the H-beam shaped reinforcement sections were 10 to 12 feet deep between flanges, with fillets 4 inches thick. These extended into the Old Bay Mud, 55 feet below station platform level (Fig. 8). The station's interior was constructed between May 1974 and November 1975.
The Embarcadero, Montgomery and Powell Stations along Market Street were constructed in this manner, using cut-and-cover, with contractor staging on temporary platforms built atop the excavations. Only busses and trolleys were allowed on Market Street during construction, running along either curbside. The lower Market BART stations were constructed between July 1967 and April 1972. Construction staging was alternated from north to south sides of Market during that interim, and the street was re-opened to traffic in February 1973. Work on the MUNI stations began in early 1973 and was completed in 1978.
Several tunnel contracts were let along Market Street to connect the combination BART/MUNI stations, requiring four tunnels on two levels, up to 70 feet deep. Morrison-Knudsen was given the contract for the lower 725 feet of tunnels and the shell excavation of the Embarcadero Station in February 1969. At Powell Station , five streets converge and the Powell Street cable car line terminates. In 1970, a $10.4 contract for 1,900 feet- long four-bore section of the BART and MUNI tunnels (see Fig. 8) was given to Delaware Vianini Memco Corporation (DVM), a joint venture of Vianini, Spa, Rome and Mining Manufacturing Corporation. DVM chose to employ a hydraulically operated mole TBM with a 3-feet diameter central cutting wheel and an wedge shaped blade openings, which could extend between 3 inches and 3 feet in width, depending on the softness of the ground encountered. PBTB recommended that the 17.5 feet diameter bores be driven under 10 to 12 psi air pressure, because of the high groundwater table in poorly graded sand and clay.
Like the lower Market tunnels, working room was extremely limited, and the contractor was confined to a 50 x 75 feet shaft to service all four bores. DVM developed a specialized 60 cubic yard muck car 41 feet long, that could be passed through an oversized air lock, designed by Jacobs Associates of San Francisco. The 60 yard muck car could accommodate material from two 2.5 feet advances of the moles. The muck car dumped its load into a 60-yard capacity bottom dump hopper, situated at the base of the access shaft. DVM then placed a rail-mounted 200-ton gantry crane over the 50 x 75 shaft opening, which could lift the bottom dump hopper and move 100 feet away from the shaft, for bottom dumping of the muck into dump trucks.
DVM's progress on these tunnels using their TBM mole was impressive, boring through 1,300 feet in 17 working days, with 107 feet in their best single day (ENR, January 14, 1971). DVM drove three of the four tunnels under air pressure, then convinced BART to share the savings by driving he last bore without additional air. Average rate of advance under air was about 40 feet per day, and 55 to 60 without. When the mole ran into soft ground, they closed the wedge-shaped blade openings down to about 3 inches, and this prevented overbreakage. Maximum subsidence on the job was only 5/8 inch.
At Van Ness and Market, the BART and MUNI systems diverge, and BART turns south, along Mission Street. The 5,000 feet long segment between the Civic Center and 16th Street Stations were excavated as twin tunnels with a mechanical mole tunnel boring machine (TBM), by a joint venture of Morrison-Knudsen, Brown & Root and Perini Corporation, for $18 million. Two 93-ton mechanical mole was built by Mine Equipment Manufacturing Corporation (Memco) were 18 feet in diameter, capable of developing 1.7 million ft-lbs of torque on the cutting head. They used 1 inch thick steel plates, with a closed face using four hydraulically operated doors. The doors employed cutting edges that scrapped soil off the face as the head rotated up to 4 revolutions per minute. The mole was advanced in increments of 2.5 feet, using twenty-nine 115-ton hydraulic jacks (ENR, Aug 3, 1967; Peterson and Frobenius, 1971).
The 16th Street tunnels were 40 to 80 feet deep, cutting through alluvial deposits dominated by fine sand, but including clayey and silty sand as well, as shown in Fig. 9. Several pockets of silty clay were avoided. The biggest concern prior to excavation was with dewatering. The contract allowed two methods of controlling groundwater -- by means of deep wells or by using compressed air inside the tunnel. The contractor elected to use both methods, with varying degrees of success. Those sections employing compressed air at 12 psi tended to record less settlement. 12,841 feet of tunnel were excavated under air pressure, while 6,215 was driven under free air.
The twin tunnels were lined with 30 inch wide steel ring liners, using 6 circular segments and one smaller "key" segment. 64,000 feet of 18-feet diameter shield driven tunnels were lined in this manner during construction of BART. These liners were described in Wolcott and Birkmyer (1968). To fill the annular space between mined ground and the tunnel lining plates, the contractor was given the choice between using a one-shot cement grout or air-blown pea gravel, followed by grouting at a later date. Neither system proved entirely successful, as grout constantly leaked out and pea gravel mixed with the soft surrounding ground sufficiently to complicate finish grouting later, as there was to pore space to grout.
Of great concern to area residents was ground settlement, because the line curved beneath several blocks of existing structures. Where the tunnels were driven in free air, the settlements due to dewatering was between ½ and ¾ inches, and the passing of the tunnels added another ¼ inch of movement, directly over the tunnels. Where the tunnels were driven under compressed air, settlements were usually under 3/8 inch, or less than that accomplished with the conventionally dewatered segments.
One of the problems encountered with the mechanical mole TBM was the inability of the operator to "see" the ground he was excavating. When the cutting head encountered moist sandy soil, the effective cohesion diminished with increasing disturbance and the overlying ground began to run into the face of the mole, causing excessive settlements, and in some cases, sinkholes, above the tunnel. Checks were then developed to prevent over-excavation by comparing rates-of-advance to volume of mucked material. These sorts of comparisons are now commonplace. Tunneling rates of up to 70 feet advance in 24 hours were recorded on these segments, but the average rate of advance was 150 feet per 5-day work week. The general aspects of construction of the 16th Street tunnels were described in Thon and Amos (1968).
A joint venture between Peter Kiewit Sons and Traylor Brothers were awarded the contract to excavate twin tunnels down Mission Street, south of the 16th Street Station. They chose to employ a Calweld oscillating tunnel boring machine (TBM), the only such device used on BART. The oscillating TBM employed four independently activated cutter blades, each covering a quadrant of the tunnel face, sweeping back and forth, like windshield wiper blades. Each blade was powered by two rams with a 15-inch stroke. The machine was advanced by means of 20 shove jacks, with a capacity of 3,020 tons, moving forward in 2.5 feet increments. These machines were designed for excavating more blocky ground, and fared very well (Peterson and Frobenius, 1971).
BART was one of the earliest American projects to employ tunnel boring machines (TBM's), then a rarity. This came about as a result of the project introducing "value engineering", a concept which allows the contractor to share in the profits of alternative designs or construction procedures which reduce the estimated construction costs of each subcontract. This policy had been drafted by PBTB's Joint Consultation Committee, and accepted by BART management.
The most novel proposal for value engineering was submitted for the use of a Java Mark I mole TBM, equipped with rock-bit cutter heads, in lieu of conventional drilling and blasting for the 3,450 feet long Fairmont Hills Tunnels, between Randall Street and Glen Park Station. The Fairmont Hills Tunnels were singled out as a "rock excavation contract", between the soil tunnels bored beneath Mission Street with a soil cutter blade mole TBM, and the Glen Park Station. The route lay beneath the sloping face of the San Miguel Hills (beneath Chenery Street and parallel to San Jose Avenue). This alignment cuts through Franciscan strata of varying hardness, including sandstone, chert, greenstone, sheared shale, serpentine and silica carbonate rock, with up to 140 feet of cover (Chandler, 1969).
"Greenstone" was a catch-all term used at the time to describe various types of extrusive volcanic rocks which have undergone low-temperature high-pressure metamorphism along the subducting continental margins. This unit varied in consistency from light-green tuff to dark-green to black diabase basalt. Because of the variability of rock types and the massive nature of the greenstone, PBTB engineers had assumed that TBMs would hamper progress of the overall project, and had specified conventional drill-and-blast methods for this contract.
After considering the number of existing structures lying atop the proposed alignment, the absence of any major faults, and the moderate overburden, the contractor offered a reduction of several hundred thousand dollars for approval of his using a TBM. His analyses were based in large part on worries of the potential costs of settling residential damage claims ascribable to blast vibrations. By reducing this potential, a sizable contingency was also reduced in terms of cost and time to completion. The use of the TBM was then permitted and work commenced in July 1967 at a cost of $9.2 million.
The tunnels were dug from a shaft excavated near the intersection of Randall Street and San Jose Avenue, where thin alluvial deposits overlie the Franciscan bedrock. The first 180 feet of both tunnels was excavated by conventional techniques, in order to acquire the requisite space to set up the Java TBM. The rough bores were circular, 20 feet in diameter. The only problems encountered occurred while cutting through serpentine and silica carbonate rocks, although the hardness of some of the greenstone stymied the TBMs advance. zones cause the TBM's rate of advance to slow. Completely sheared and crushed serpentine encountered near Sta. 232+00 causes delays in construction, because of severe overbreakage and binding.
One of the surprises for PBQD geologists were mud filled cavities found in the silica carbonate rocks (Chandler, 1969). Occasionally, these cavity filling would drop into the tunnel behind the mole, necessitating crib support. Water inflows throughout the tunnels were low and tended to decrease with time, but a seasonal fluctuation was noted (Chandler, 1969). The more or less continuous inflow emanating from the sheared serpentine aided in the instabilities that hampered tunneling progress. Circular steel support sets were placed behind the mole, spaced 2 to 4 feet apart throughout the tunnels. With the exception of the sheared serpentine, no obvious loading was noted on these sets prior to placement of the concrete linings.
The Glen Park Station lies at the south end of the Fairmont Hills Tunnels, adjacent to the Southern Freeway (Interstate 280). Excavation for this station was extensive, being 750 feet long, 45 feet wide, and extending 75 feet below original ground surface. The excavation penetrated artificial fill, estuarine marine clays, colluvium, Colma formation sands, and weathered Franciscan strata. Towards the south end of the station, the excavation bottomed in the Colma sands, which became increasingly indurated, characterized by a reddish iron staining. The remainder of the excavation was floored in the Franciscan units.
Temporary support was with steel H-piles with wood lagging, spaced 8 feet apart. The station excavation's narrow width lent itself to the use of interior bracing, using 20-inch diameter steel pipe struts. The station was excavated with ripper equipped bulldozers. During construction some instability of the temporary support occurred near the northern end (in sheared Franciscan material), and this was controlled by placing a concrete thrust block at the base of the opposing face, and installing raker struts. A minor slope failure also occurred towards the south end, in the Colma formation, adjacent to Joost Avenue. Traffic vibrations were believed to have been partly responsible for the apparent loss of cohesion of the Colma beds (Chandler, 1969).
An integral part of BART's original plan was to incorporate their 90-feet wide right-of-way within the median of State Highway 24 through central Contra Costa County, between Orinda and Walnut Creek. Approximately eight million cubic yards of earth was moved to create this dual transit corridor, with BART financing relocation of the existing westbound freeway lanes and their own facilities, while the State Division of Highways payed for enlargement of the freeway from 8 to 10 lanes. All the excavation and structural improvements in this segment were managed by the highway department, and a maximum grade of 3.5% was maintained, per BART requirements (Payne, et al, 1968).
In June 1966 excavation began of a new circuitous west-bound alignment for Highway 24 in Orinda, to create a staging area for the 3-mile long Berkeley-Oakland Hills Tunnel. After completion of the tunnels, the staging area was converted into the Orinda BART Station, which opened in February 1973. By September 1966 a sizable portion of the natural hill-side northwest of the staging area had been excavated at an inclination of 1.5:1. The hillside above this new cutslope began to detach and slide towards the new freeway alignment and the tunnel staging area. USGS geologists Dorothy Radbruch and Jim Case made a visit to see the enormous slide, and Case pointed out the exis-tence of the Moraga thrust fault across the cut face. Case had previously postulated the fault's existence in this area during field work for his Ph.D. studies at U.C. Berkeley (completed in 1963).
During 1967-68 the State Division of Highways was forced to mitigate the slide, with BART paying the cost. A grading solution was chosen, laying the base of the slope (in the Mulholland formation) back to a 3:1 inclination, then transitioning to a 2:1 cut in the overlying (but older) Grizzly Peak (Moraga) volcanics, exposed upslope of the Moraga fault. The Moraga fault perched groundwater flowing through the pervious Grizzly Peak (Moraga) volcanics, which dip eastward, towards the BART Station. This creates a situation whereby high pore water pressures are developed in the hillside. The Moraga fault is believed to be an ancillary thrust connected to the Hayward fault at depth (Borchardt and Rogers, 1991).
Although this "repair" cost BART just under $35K, the new cut slope began to develop large tension cracks in the winter of 1972-73. An extreme frost hit the hills of the East Bay during the winter of 1972-73, followed by a heavy storm sequence during the last week of January, which caused numerous debris flows and surficial erosion throughout the Bay Area. The 1967 cut slope began to slide onto the westbound on-ramp of Highway 24, adjacent to the Orinda BART Station. A large tension crack developed in the Grizzly Peak (Moraga) volcanics, up above the Moraga thrust, which became an obligatory field trip stop for U.C. Berkeley geotechnical engineering students between 1973-80.
A record two-year drought hit the area between 1975-77. In early February 1978 the rains seemed to return with a vengeance. On February 12th, approximately 100,000 cubic yards of bedrock material mobilized and began to creep down onto the westbound onramp of Highway 24 (Fig. 10). Under their original agreement, BART was obliged to reimburse Caltrans for any slope failures that occurred within 10 years of BART-related freeway realignments, but this clock had ticked its course by 1976. In 1980 Caltrans spent $500K to repair the 1978 Orinda BART Station slide. This repair experienced some reactivation during the winter of 1982-83, but did not encroach the freeway. It has been relatively quiescent since.
Exploration of the proposed 3.1-mile twin tunnels between Lake Temescal and Orinda were undertaken by Bechtel Corporation geologists in 1963-64, costing about $3.1 million. Most of the collected data was contained in a series of reports released in June 1964. Bechtel drilled 5,000 feet of NX diamond core in 32 exploratory borings along the proposed alignment, with depths up to 600 feet. Several of the holes were angled to penetrate greater stratigraphic sections through inclined strata. This information was supplemented by surficial mapping, and the subsequent excavation of two 5 x 7 feet exploration adits, 1,000 feet long at the east portal and 1,412 feet long at the west portal, completed between May and September 1964. Insitu strength and indices tests were performed by Bechtel personnel in both adits, including extensive measurements through the Hayward fault zone. These tests suggested that the relaxation zone tended to form within 10 feet of the test adit and that 25% of the dilation occurred within 3 feet of the openings (although the test adit was much smaller than the finish tunnel).
Comparisons were also made with earlier geologic mapping within East Bay Municipal Utility District's (EBMUD) Claremont water supply tunnel (completed in 1929), San Pablo water tunnel (completed in 1952) and the Caldecott Highway Tunnels (completed in 1938 and 1962). The west portal of EBMUD's Claremont Tunnel is located about 500 feet northwest of the BART west portal. Bechtel's geologic cross section is included herein as Fig. 11.
From their west portal, the twin tunnels pierce undifferentiated Franciscan assemblage rocks, the Hayward fault, Leona Rhyolite, undifferentiated Great Valley Sequence (Cretaceous age) sediments, the Sobrante and Claremont shale/chert members of the Monterey formation, Orinda formation conglomerate, siltstone and claystone, Grizzly Peak volcanic series, intrabasinal sediments, back into volcanics, Siesta formation basinal lacustrine silts and clays, then back into Grizzly peak volcanics and sediments, finer grained Orinda series units, then Grizzly Peak volcanics and intrabasinal sediments at the east portal.
The tunnel paths crossed the Hayward fault zone about 900 feet east of its west portal, the Wildcat fault zone about 500 feet east of the west portal, Lawson's old Pinole fault in Gateway Valley (about 12,600 feet east of the west portal) and several other unnamed faults. The Moraga thrust appears to crease the tunnel's Orinda portal, and was not mapped as part of the study.
The parallel tunnels were to be 3.1 miles long, on an overall 1.2% uphill grade preceding northeasterly (rising at 2% to the tunnel mid-point, then at +0.3 % grade to the east portal). Trending N 61o E, the tunnels cut the predominant strike of the folded late Tertiary-age strata at about 45 degrees. 19 load zones within prescribed segments of the tunnels were identified along the tunnel alignments, on the basis of the geologic units encountered in the exploration. Each of these were assigned a Terzaghi load factor, according to Proctor and White (1946), and different loads were estimated for the temporary sets and the permanent lining.
The Board of Consultants considered the Terzaghi (1946) load values to be too high and that lower loads could be utilized for design of the support sets. Bechtel engineers then used the method of analysis prescribed by Drunker (1943), which derived equations from the lateral passive soil pressures, developed for cast iron lined tunnels in soft clay. Assumed values for rock compressibility were derived for the 19 load zones, and the resulting pressures were 30 psf acting vertically and 18 psf acting horizontally. The design process was summarized in Brown, et al (1981).
The tunnels were intended to be excavated at a diameter of around 19 feet, with an expected average overreach of 1-1/2 feet. 100 feet of rock was to be left between the tunnels, with cross cuts every 1000 feet. The spacing between tunnels narrowed to 55 feet at each portal. Each bore was to be braced with 8-inch WF40 steel horseshoe shaped sets, spaced on 4 feet centers with invert struts, dropping to 2 feet centers within the Hayward fault zone (between Stations 650 and 1300). Inside this bracing the finish tunnels were lined with at least 1.75 feet of reinforced concrete, using a modified circular section, shown in Fig. 12. The finished inside diameter was 17-1/2 feet.
Because of the anticipated high loads, the finished tunnels were to be circular, constructed within the excavated horseshoe-shaped section. The inside radius of the finished tunnels was 3 inches greater than the "standard" circular tunnels used on BART, due to uncertainties at the time about the final configuration of the BART cars. In order to retain flexibility, an 18-inch thick lining was prescribed, with extensive subdrainage. This was felt at the time to be a thin a lining as practicable.
After the preliminary design values discussed above were arrived upon, Insitu rock tests were carried out with the two exploratory adits excavated in late 1964. The west adit encountered about 700 feet of gouge and crushed rock, mostly serpentine, thereafter termed the Hayward fault zone (Content, 1967). Load cells were placed in the west exploratory adit to gain insight for design loads through the Hayward fault zone, problems from which had plagued previous tunnels in the area (West, 1965). They installed load cells between the excavated rock and the tunnel supports, as well as some extensometers. This data suggested that in the Franciscan formation, the relaxation zone developed within 10 feet of the 5 x 7 feet adit. 50% to 75% of the movement occurred within 3 feet of the opening and that loads tended to stabilize within 5 to 20 days after excavation. However, within the Hayward fault zone, only about 25% of the movement was detected with 3 feet of the opening, with the remainder of the volumetric relaxation occurring between 3 and 10 feet, and possibly further. About a quarter of the rock movement was observed to occur within 12 days of excavation, followed by a reduced rate of change.
During the design process in 1964, considerable foresight and attention was drawn to the appropriate accommodation of loads that might be generated within the Hayward fault zone. Bechtel geologists recognized that the fault had spawned earthquakes in 1836 and 1868, but made no mention of aseismic creep, which had been the subject of considerable note within and beneath Memorial Stadium at nearby U.C. Berkeley, 1-1/4 miles northwest of the west portal. Berkeley seismologists had been measuring aseismic creep-induced offset of a buried concrete culvert beneath Cal Memorial Stadium since mid-May 1964, but until that time the data not been published (Bolt and Marion, 1966).
A public debate erupted on September 29, 1965 when the U.S. Geological Survey (USGS) released a press release describing the potential for damage to structures situated along the Hayward fault, citing aseismic creep being noted along the fault, particularly at Berkeley's Memorial Stadium. This was followed up on October 7, 1965 by the installation of a slip-meter within the concrete culvert being displaced beneath Memorial Stadium.
Adding crediblility to their assertions, in early 1966 the USGS released Circular 525, titled "Tectonic Creep in the Hayward Fault Zone California". This publication contained five articles detailing various aspects of aseismic creep measured along the Hayward fault. In Circular 525 Radbruch and Lennert (1966) described the fault-induced offset they observed in June 1965 while inspecting two reinforced concrete culverts running beneath and next to Cal Memorial Stadium. The oldest culvert had been inspected about every ten years since being built in 1923, and noted tensile displacements correlating to an average creep rate of about 2.8 mm/year. In 1966 NOAA established a survey network at Memorial Stadium that recorded an average creep rate of 5 mm/year between 1966-69 (Miller, 1970). These measurements were recognized to be lower bounds thresholds, because the fault actually bifurcates beneath Memorial Stadium and widens itself northward. In addition, the Strawberry Creek culvert crosses the fault at an acute angle (20 degrees), which greatly complicates resolution of offset measurements, which must be inferred from tensile separations at various joints. By 1989, Schultz (1989) noted that the Strawberry Creek creepmeter missed the active trace of the Hayward, and that the Stadium had actually been offset by 13 inches of aseismic creep, which would correlate to an average rate of about 5 mm/yr.
In Circular 525, Blanchard and Laverty (1966) also reported on their measurements of tectonic offsets through EBMUD's Claremont Water tunnel, completed in 1929. They reported an average offset of 4.8 mm/year. The published report concerning offset of the Claremont Tunnel could not be ignored by Bechtel engineers, in that these were measured only 500 feet northwest of the BART portals! Due to these revelations, PBTB was forced to deal with the issue, even though the tunnel contracts had already been let without any mention of special design or construction provisions for accommodation of aseismic creep along the Hayward fault.
A $31 million contract for the Berkeley Hills Tunnels were let to a joint venture of J. F. Shea Co., Kaiser Industries and Macco Corporation in the fall of 1964. Actual construction began in early February 1965, the tunnels were holed through in March 1967, with construction being completed in July 1968. The tunnels were driven using conventional drill-and-blast methods, with a full face, pulling 4 feet deep blast rounds. They excavated the two bores simultaneously with offset, working four headings (two from each end). The contractors used a jumbo rig to drill the face, then placed conventional steel support sets with maximum spacing 4 feet on center. 26.5 million pounds of steel was estimated for the job while 27.021 million pounds were actually used. The average rate of advance was about 19 feet per day per heading.
Numerous springs and seeps were monitored within both test adits, as well as within the exploratory borings. Standpipe measurements in the borings suggested as much as 850 feet potential head over the tunnels near the drainage divide (near Sta. 72+50). In order to effect gravity drainage from the four working faces, the design was altered to provide a 1.75% grade westerly, to a high point 5,100 feet from the east portals. From this drainage divide a 0.3% grade was maintained eastward, towards the east portals. Tunnel alignments were maintained using newly developed laser survey methods (Colson, 1970). For bid purposes, the potential water inflow was estimated to be as much as 6000 gallons per minute (gpm) initially, diminishing to about 2000. The actual inflow during construction was estimated to be about 650 gallons per minute (gpm) at the portals. Maximum inflow at the face occurred when the bores penetrated the Grizzly Peak formation's basaltic flow breccia, where inflow was estimated to be about 300 gpm. In general, inflows decreased as the headings advanced.
When the face of the north bore reached Sta. 1203+75 on October 8, 1965, cross tunnel measurements indicated that the ground was squeezing inward at a rate of 1 inch per day for a distance extending 180 feet back from the face. Eight feet long rockbolts were installed horizontally at the base of each post, with channel whaler anchors connecting each bolt. Excavation was halted and 6 x 8 inch timber floor spreaders were installed at each post extending 300 feet behind the face. The invert (tunnel floor) was then deepened by 2 feet and 8 inch WF40 steel invert struts were installed to transfer load across opening. Set spacings across the fault zones were usually 2 feet instead of the usual 4. Invert struts were also placed in the Hayward and Wildcat fault zones, as well as within the faulted (overturned) Siesta Syncline. Because of difficulties in maintaining support during construction the arch of the finished tunnel was lowered by 2 inches within the Hayward fault zone.
Bechtel engineers noticed that the squeezing generally decreased over a period of one to two months. The squeezing was noted again during re-timbering and realigning sets in preparation for placing the interior concrete lining. Of the 11,101 steel sets installed in the two bores, 1,597 experienced deformations that necessitated replacement or realignment. After holing through, the contractor began placing invert concrete in June 1967 and in December 1967 concreting of the arches commenced, using telescoping slip forms.
As the tunnel went to construction, considerable thought was given to the possibility of accommodating possible track shifts, if the Hayward fault was actively creeping. The a design diameter of 17-1/2 feet was ½ foot greater than the standard diameter used throughout the BART system (Fig. 12). Based on available information gleaned from the October 1868 Hayward quake, an investigation was made assuming 24 inches of horizontal and 12 inches of vertical shift along the Hayward fault. It was concluded that if such tectonic offset were to occur on a single discrete surface, the tunnel's radius would need to be increased by another 10 inches to accommodate track shifting. However, if such movement were distributed over 300 feet of the Hayward fault zone, 53 inches of horizontal movement could be accommodated without changing the tunnel's design radius.
In October 1966 a change order was issued allowing for the installation of load cells and extensometers at 16 locations in the north tunnel, between Sta. 1218+86 and 1254+25, across the Hayward fault zone. By February 1967 a total of 75 load cells were installed, 4 to 6 at each location, located at the 10 and 2 o'clock positions in the crown, between the rock and the interior concrete lining. These load cells were recorded at regular intervals until the steel sets were reblocked just prior to placement of the concrete lining in March 1967. Three sets of cells were left in place for after construction monitoring. In addition, 16 30-feet long and four 10-feet long rock movement indicators were installed horizontally at the springline in the north bore through the Hayward fault zone, between Stations 1198 and 1206+50 (BART, 1977). During construction the Hayward fault zone was believed to cross the twin bores at two locations: one near Sta. 1197 and the other near Sta. 1202+55.
In response to increasing public awareness attendant to possible creep of the Hayward fault, BART issued a change order to the track construction contract which replaced the concrete ties with wooden ties. These would facilitate on-going track realignment across the Hayward fault zone during operations.
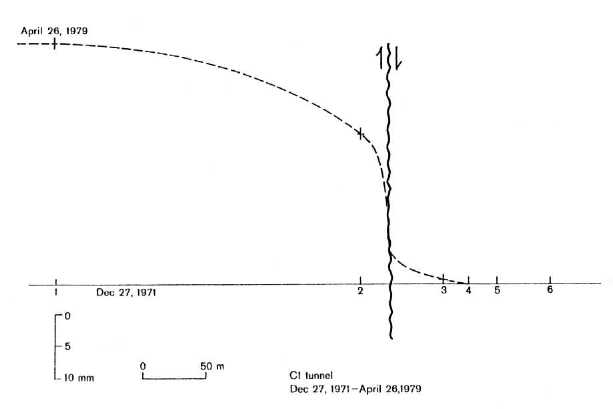
BART carried out careful alignment surveys since completion of the tunnels in 1968. Curious results recorded over the first few years caused speculation about the source of apparent errors or drift. As a result, extensometer measurements were resumed in the Hayward fault zone and a program of performing horizontal alignment surveys was established in December 1971. This was continued throughout the succeeding decade. Between 1969-81, approximately 80 mm or right-lateral offset was conclusively recorded in the north tunnel, as shown in Fig. 13. The average rate of creep was between 6 and 8 mm/year up through 1981 (Brown, et al, 1981), distributed along a 220 feet wide zone. By 1979, the lining of the tunnels exhibited considerable cracking, with a thrust component, as sketched in Fig. 14.
An extensive study of the BART tunnels through the Hayward fault was commissioned by BART and the Federal Urban Mass Transit Administration between 1979-81. This study was performed by Ian Brown, Tor L. Brekke and Greg Korbin in the Geological Engineering program at U.C. Berkeley, and reported in Brown, et al (1981). Their study found that the load cells still found to be operable recorded increased passive pressures on the northwest side of the fault and decreased active forces on the south, consistent with right-lateral faulting. Most of the displacement occurs with the mapped gouge zones. The study concluded that BART must continue to monitor damage to their linings and make periodic adjustments to the tracks, but they were unable to calculate how much future realignment can be accommodated, because that depends on the structural reaction of the tunnels to the imposed shear strain, which is spread over a zone. The thick concrete invert of both tunnels (lower half of Fig. 12) serves to spread the lateral strain over a slightly wider zone, and thereby, dissipate the shear strain. The three dimensional effects of these asymmetric linings could not be calculated with the analytical procedures then available (the computer program LINER). The Brown, Brekke and Korbin (1981) report recommended maintaining future monitoring efforts.
BART was one of the first high-visibility projects where tunnel boring machines (TBMs) were used extensively in a variety of mixed ground conditions, by a number of different contractors. TBMs proved themselves capable of sustained operations with increased rates of excavation and reduced overhead settlement, but with increased downtime. Peterson and Frobenius (1971) reported that the average tunnel cycle was reduced from 105 to 65 minutes with TBMs, and the average rate of advance increased from 25 feet per day (fpd) with hand methods to 40 fpd with TBMs. But, in those days, the rate of downtime was a discouraging 22% for TBMs, as compared to only 5% for hand mining. Since roughly the same number of men were required in both techniques, this downtime resulted in considerable loss to the contractors. Settlement ground control for the TBM mined sections was well above average, and contributed to lessened construction claims by adjoining land owners. In the years that have elapsed since BART, most if the operational "bugs" common to that ear have been worked out of the process, and most urban tunnels are excavated to day using TBMs.
An unexpected aspect of the BART work was the wealth of geotechnical data that was suddenly amassed. Not all of this data has ever been synthesized or fully explained, from a geologic perspective. The BART Richmond-Fremont line parallels the old Western Pacific Railroad alignment (now owned by the Union Pacific) from Laney College in Oakland to Alameda Creek in Fremont (where the railroad turns northeasterly, up through Niles Canyon). Exploratory borings taken at the site of the Hayward Station by Dames & Moore in 1965 revealed that estuarine clays were encountered 3-1/2 miles from the Bay. Rogers, et al (1994) suggests that depth to the Franciscan basement in this area is about 165 feet. The basement drops below -1,000 feet west of the Southern Pacific tracks 3 miles southwest.
Based on the work of Rogers and Figuers (1992) and Figuers (1998), it is likely that these estuarine clays are probably a part of the Irvington Aquitard, which Figures correlates with the Yerba Buena Mud (formerly termed Old Bay Mud), which extends beneath much of the East Bay Plain, including all of downtown Oakland. These units were deposited during the Sangamon interglacial stage approximately 116 to 100Ka, when sea level rose to a level approximately 22 feet higher than present.
The southern terminus of the Richmond-Fremont line is the Fremont Station, built adjacent to Tule Pond (originally referred to as Tyson's Lagoon), a sag feature along the south Hayward fault, just south of Mowrey Boulevard in Fremont. Surface faulting of the Hayward fault was recorded in this area during the October 21, 1868 Hayward earthquake. In this area the Hayward fault is characterized by a north-trending dual trace, which creates two sag ponds, Stivers Lagoon (now called Lake Elizabeth) and Tyson's Lagoon (Tule Pond), recognized as such by Clarke (1924).
During exploration for the Fremont BART Station, PBTB retained Cooper, Clark & Associates to excavate trenches along the west side of Tule Pond, which identified the western trace of the Hayward fault, though this information was soon forgotten and not retained in the Special Studies Zone files the State Division of Mines & Geology began maintaining in 1973. In this respect, the trenching here and further south, at the Fremont Civic Center (by Woodward-Clyde-Sherrard in 1962) were pioneering efforts, before methods of pedogenic dating were refined. The west trace of the Hayward fault clips the east side of the BART station complex. The depth to Franciscan basement in this area is between 500 and 800 feet, covered by Pleistocene and Holocene alluvium from the Niles Cone.
Williams (1992) did an extensive study of the Tule Pond site, which conclusively identified a 330 feet wide pull-apart graben, formed where the Hayward fault makes a slight right bend. The Lake Elizabeth and Tule Pond sag features lie on the gently sloping alluvial fan of Alameda Creek, a dominant geologic feature of the East Bay Plain. Numerous organic materials infill the graben, and Williams (1992) was able to identify and date five major fault displacements over the past 1200 years. Aseismic creep within this area approaches 9 mm/year, but the BART alignment stays just east of the fault here and in Hayward, and has not exhibited evidence of being impacted by creep offset.
After years of anticipation, the southern portion of BART's Richmond-Fremont line opened for business at 12 noon on September 11, 1972, between MacArthur Station in Oakland and Fremont, covering the 28-mile route on a 34-minute schedule (Strapac, 1972). The electrified cars could accelerate from 0 to 50 mph in 20 seconds and decelerate from 80 to 0 mph in just 27 seconds. These were considered the operational limits carrying passengers without seatbelts (Civil Engineering, 1972). President Nixon took a ride much-publicized between San Leandro and Lake Merritt on September 27th. After visiting the BART control center adjacent to the Lake Merritt Station, Nixon announced a $38.1 million federal grant to help complete the remaining 47 miles of the system.
But, as the months passed by, more and more complications were experienced with depleted funds, a labor strike (in July 1973) and serious questions about the reliability of the automated train control system (one fatal collision and another derailment), which prevented State officials from allowing trains through the Transbay tube, although all the east bay lines were up and running by August 1973. BART trains began running between Daly City and Montgomery Station in November 1973, and permission to pass trains through the Transbay tube was finally granted by the State's Public Utilities Commission in mid-1974. The Embarcadero Station was finally opened in November 1975.
In April 1974 BART was nominated for the annual Outstanding Civil Engineering Achievement of the American Society of Civil Engineers, but lost out to the land reclamation program of Fulton County, Illinois, which recycled sewage sludge into organic fertilizer. Nevertheless, there was no denying that BART was the prototype American urban mass transit project of the late 20th Century, conceived and built as a stand-alone project. The many problems experienced with funding the project led to political reforms that have promoted numerous similar projects and extensions in the interim since BART's completion.
Contents copyright 2000 Geolith Consultants.
Contents formerly (until Jun 2000) online at
http://www.geolith.com,
a domain whose contents have disappeared and whose registration has
been allowed to lapse.
HTMLified by Richard Mlynarik